Gantt Charts - Neoteric Way of Project Management
Gantt charts, one of the most powerful tool in project management, has a significant use in allocating work, prioritizing mission, overviewing task integrates, and emphasizing important tasks!
Gantt charts are a type of bar chart that visually illustrates the start and end dates of a project, as well as its task dependencies. It was first developed by Polish engineer Karol Adamiecki in the early 20th century.
However, it was American engineer Henry Gantt who popularized their use in project management. Today, Gantt charts are one of the most popular tools for managing projects.
The Gantt chart is a visual tool that is commonly used in project management. It enables you to see the tasks that need to be completed, as well as the dependencies between those tasks.
The Gantt chart also shows you the start and end dates of each task, as well as the resources that are required for each task.
Creating a Gantt chart can be a helpful way to get a high-level overview of your project. It can also be a useful tool for communicating your project plan to stakeholders.
If you’re new to Gantt charts, this article will give you a quick introduction to how they work and how you can use them in your project management.
The benefits of Gantt chart project management
The most significant advantage of utilizing online Gantt charts in project management is that you can view everything relevant to the project in one spot. These charts may be used by project managers to see who is working on what, offer input on specific tasks, and send the pertinent information to them. This enables him to interact more effectively with team members and strengthens their working connections. A Gantt chart software allows you to see the development of a project and plan tasks so that they do not interfere with the overall progress of the project. Because you can observe the progress of activities in real-time, it allows you and those working on a project to have a better picture of how things are evolving.
More clarity leads to greater comprehension, which leads to the effective execution of a project. Using Gantt charts during project management helps both project managers and teams to track team progress, emphasizing both huge victories (such as completing a job on time and meeting a milestone ahead of schedule) and catastrophic failures. One of the trends that are predicted to dominate the field of project management in the next years is remote work. A Gantt chart displays each team member’s duties and milestones in a project so that everyone is aware of his or her obligations. Transparency in the work process promotes collaboration, honesty, and humility among the team. It allows supervisors and team members an equal opportunity to emphasize how frequently they go above and beyond expectations and receive praise at work.
This article will discuss 5 sub-topics about the feature of Gantt chart and how it can help people increase work efficiencies.
- Time management creates leisureliness.
- Quickly schedule builds timeliness.
- Task dependency emphasizes priority.
- Progress percentage provides details.
Time management creates leisureliness.
Gantt charts are common tools used for time management and planning. They allow you to visualize and schedule the different tasks and activities that need to be completed over a certain period of time.
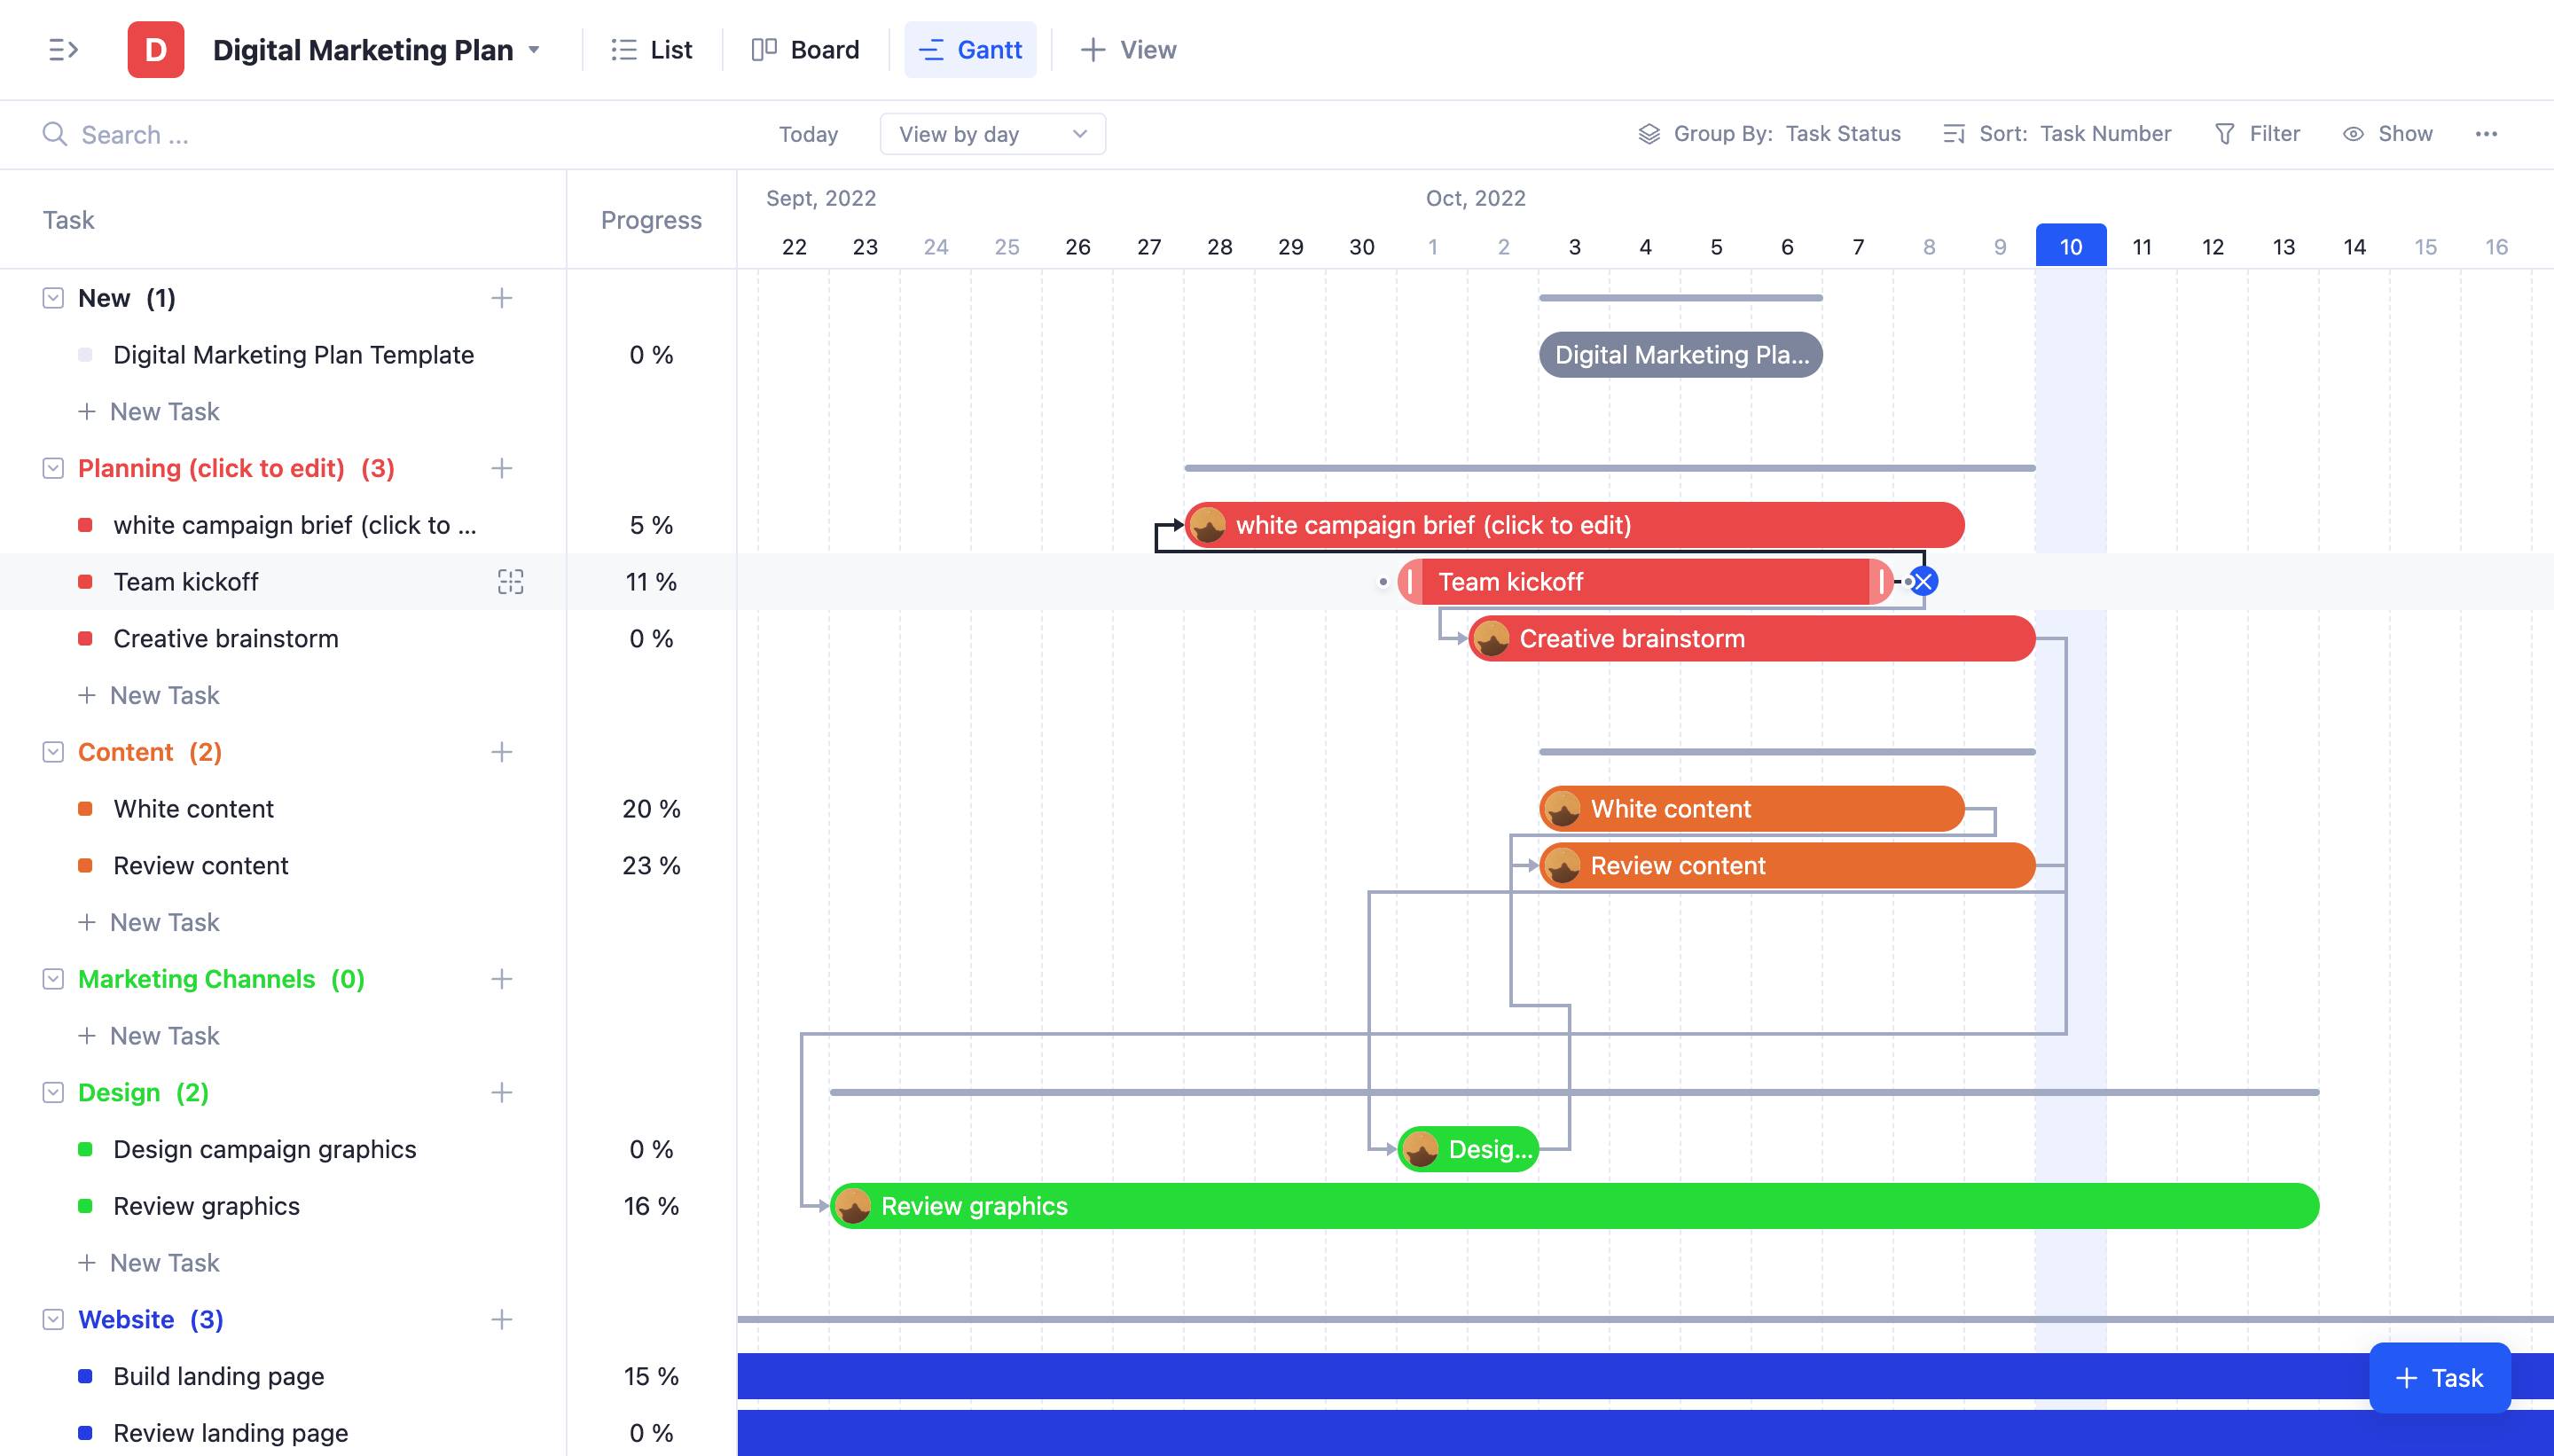
Gantt chart, which is a powerful collaboration tool that allows teams to communicate and interact in real time. With Gantt chat, users can easily discuss ideas, coordinate tasks and assign tasks, as well as communicate project deadlines. Each user can be assigned various tasks and the team can view the progress of tasks in one timeline view. This type of collaboration enables teams to work more collaboratively and increases overall productivity.
Gantt chat is also very useful for managing meetings and brainstorming sessions, as it helps teams to stay on track and in sync with one another. With Gantt chat, each team member can contribute ideas and gain insight into the project, which helps to ensure that everyone is on the same page.
Gantt chat is not just for teams - it can also be a great way for individuals to better manage their time. When using Gantt chat, individuals can create a timeline view of their tasks and remind themselves of project deadlines. This helps them to stay focused, reduce procrastination and get their tasks done in time. It also encourages them to stay organized, as it can provide a visual overview of a project from start to finish.
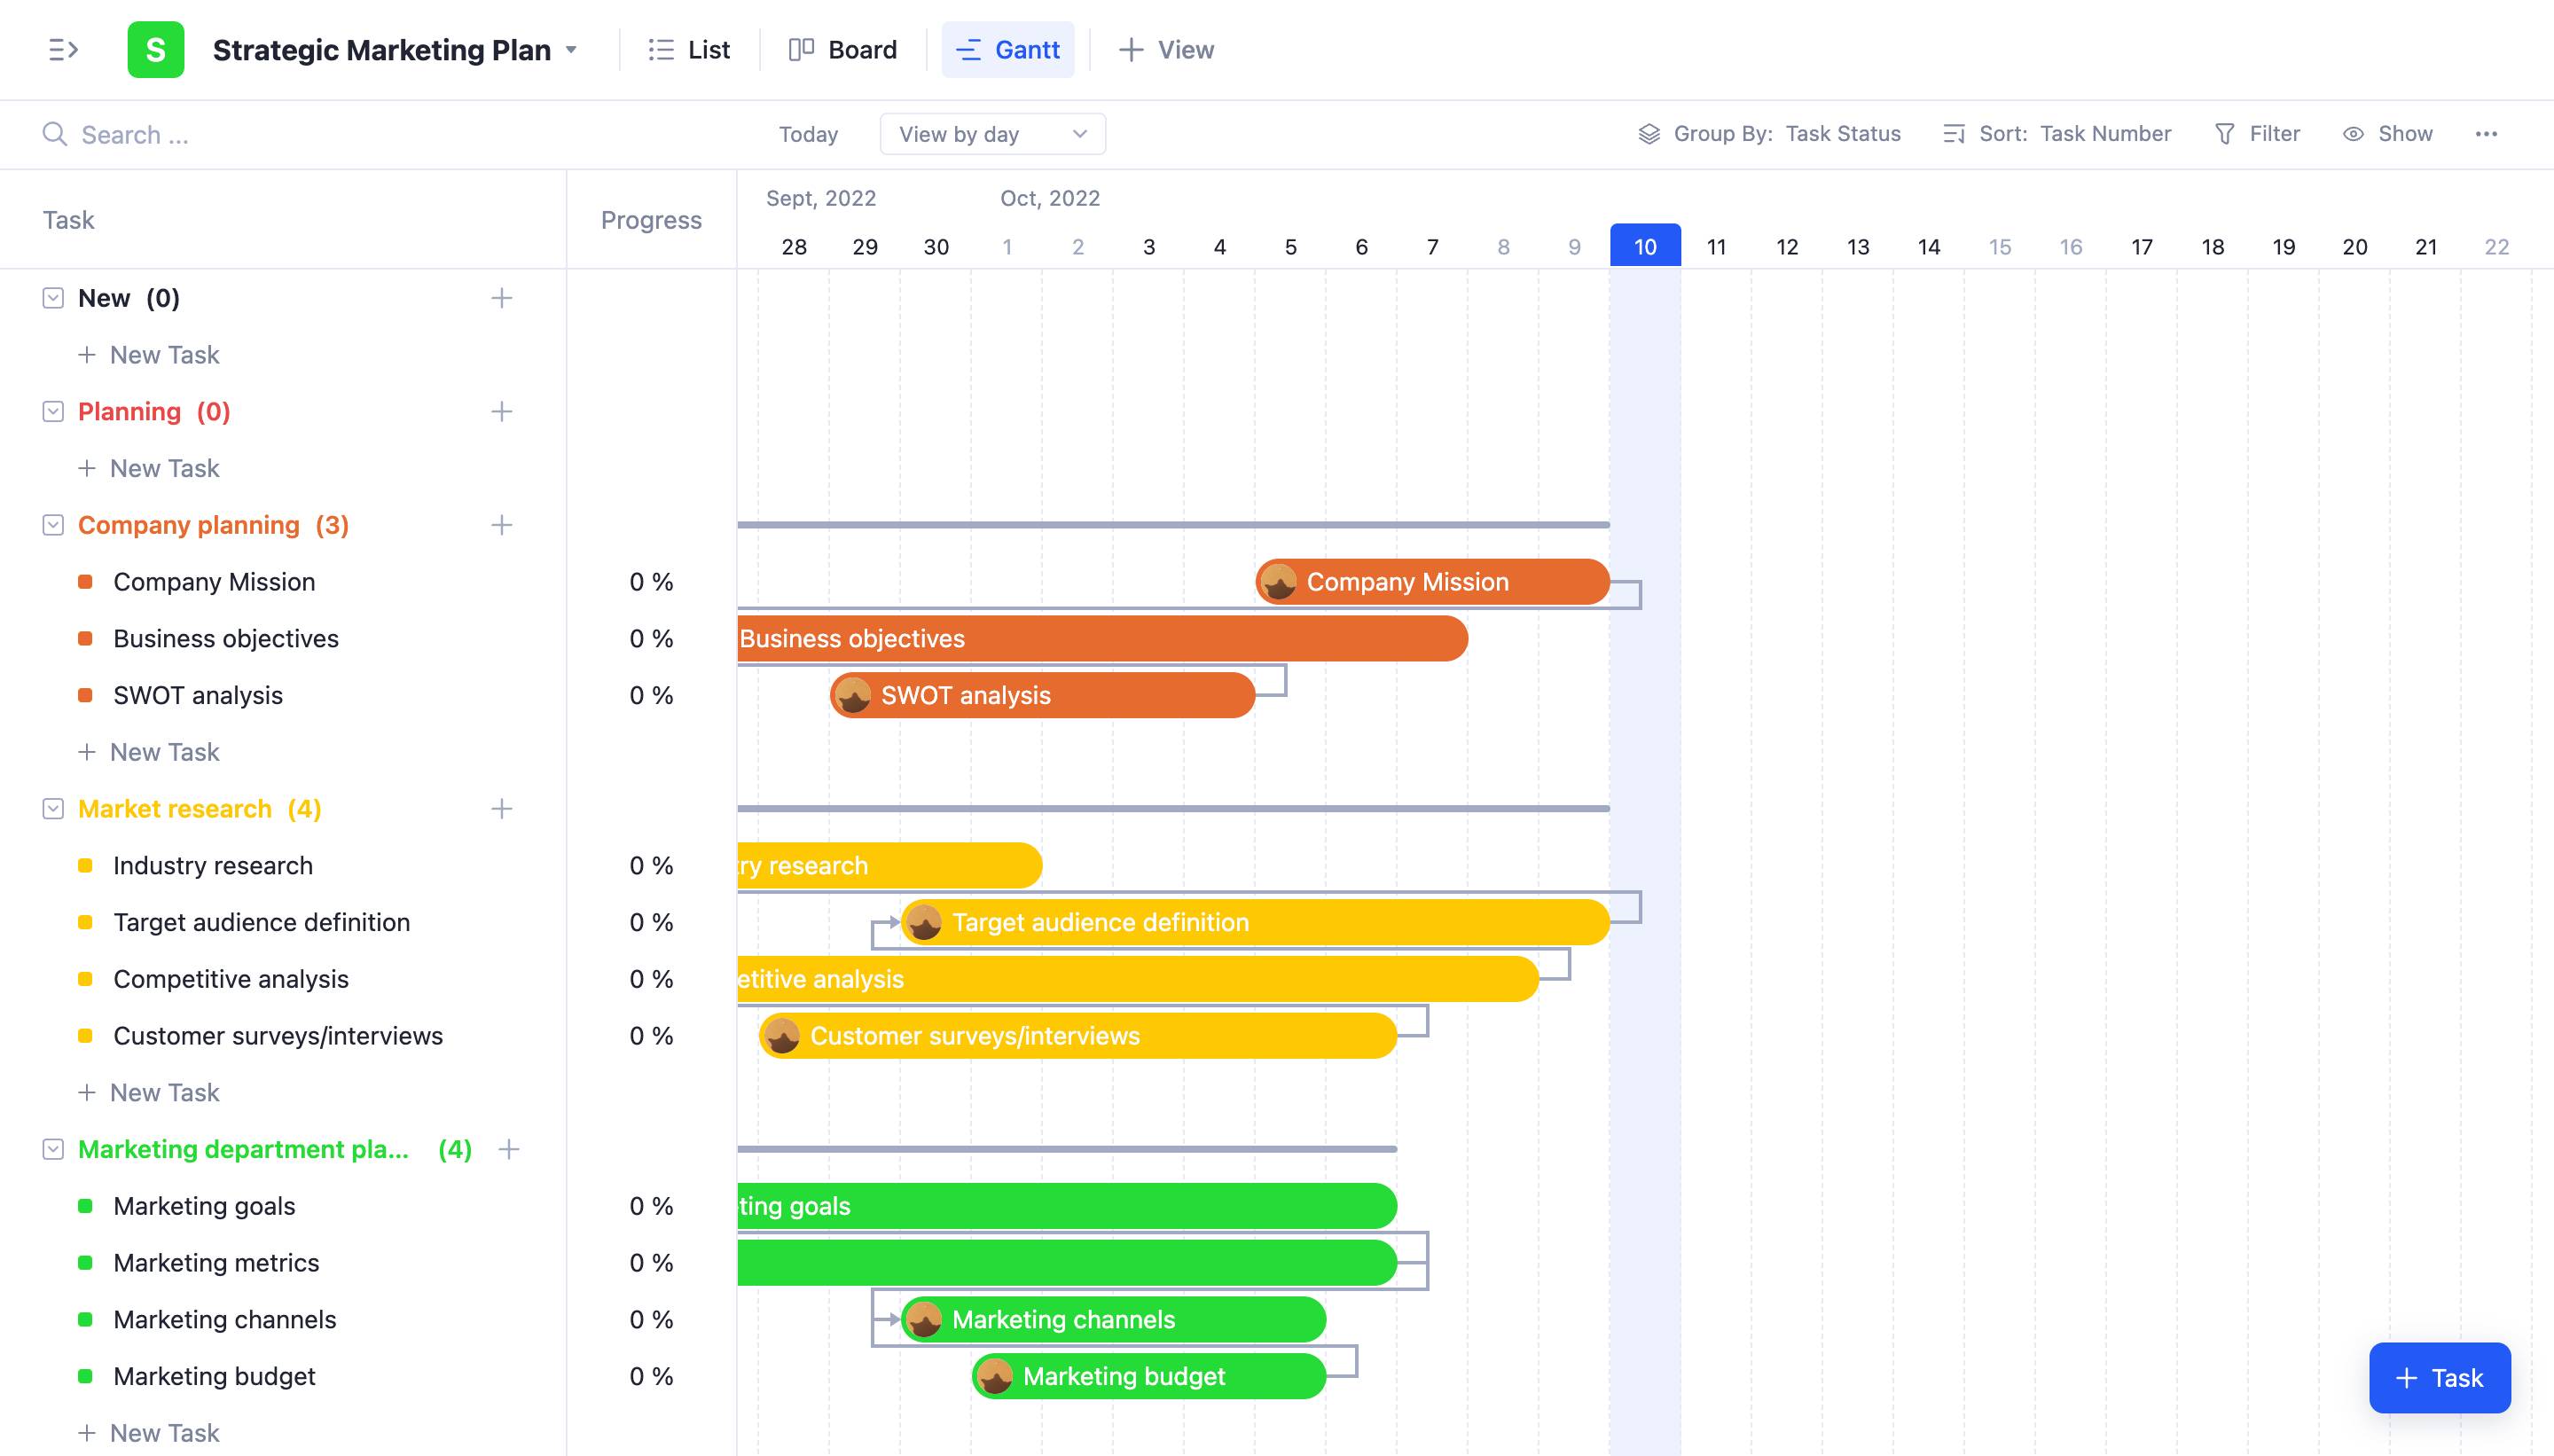
With Tracup‘s Gantt chart feature, you will find that tracking a timeline is such an easy process. You can observe tasks from a yearly view to a daily view. By simply comparing each task’s length, you will have a better idea of the due date expectation of each task. That’s why Tracup users barely miss the due dates of tasks - according to one of our long-term clients.
Overview builds great vision.
Gantt chart helps project management by providing clarity and visibility on the current state of the project.It can give users a quick snapshot of project progress, highlight any areas of risk or concern, and identify areas of opportunity for improvement.
Additionally, it can provide a quick reference for identifying dependencies between project tasks or activities, and can help to prioritize resources and tasks in order to meet deadlines or budgetary restraints.
Project management is an ever-evolving field that requires a deep understanding of the various aspects of the Task. Gantt Chart ensures that all parties involved in the project have an understanding of the overall objectives, timelines and responsibilities. It is a way for everyone to gain a thorough understanding of the project’s progress and make sure that the project is on track. This knowledge can help leadership teams identify any issues or potential problems and address them before they become more serious down the line.
Gantt Chart also simplifies the coordination of resources. One of the most complex aspects of project management is resource allocation. Through having an overview of the resources required, project managers can understand their current availability and needs in relation to the overall objectives and timeline. This can help ensure that the project is managed effectively and that the necessary resources are available.
Gantt Chart also helps in providing a general direction to the project. It gives the team a visual representation of the project’s goal and each team’s tasks. This can include any milestone objectives, required resources and deliverables. As a result, everyone involved understands their individual roles and expectations, making the project run more smoothly.
Task dependency emphasizes priority.
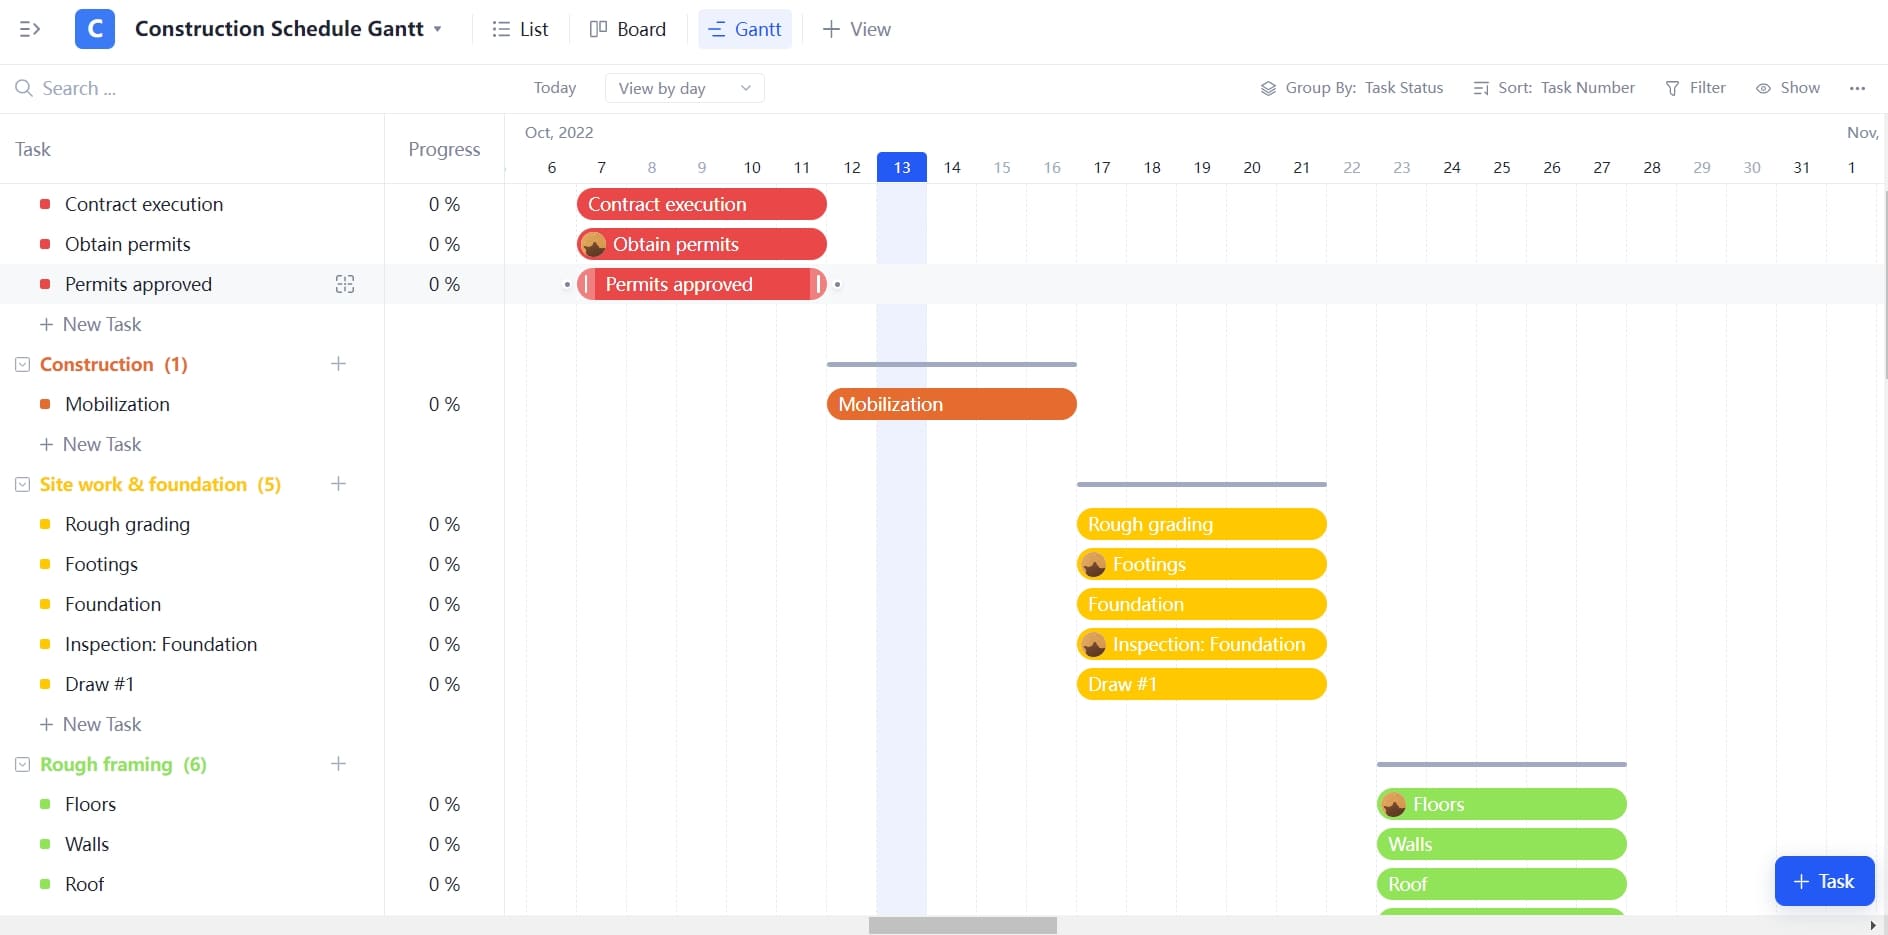
Task Dependency is a critical feature of Gantt charts which helps project managers to prioritize tasks and ensure the successful completion of the project on time.
Task dependencies are the connections between tasks that show one task must be finished before the start of another. This relationship between the two activities might be either Finish-to-Start or Start-to-Start. Knowing which activities must be completed before another task can begin helps the project manager organize the project effectively.
Critical route activities are also identified using task dependencies. The project’s critical path activities are those tasks that cannot be put off or delayed without having an impact on the timetable for the entire project. Therefore, it is simple to tell which activities are vital and which tasks are not when task dependencies are depicted in a Gantt chart.
Task dependencies make sure that the tasks that must be finished first are aligned in the proper sequence, which helps us prevent estimating errors. This aids in identifying the interdependencies between activities, or the possibility that if one task is delayed, the project as a whole may also be delayed. As a result, the project manager is in a position to decide what to do and how to proceed in order to avoid delays.
Last but not least, a Gantt chart’s visual portrayal of work interdependence enables project managers to quickly spot any possible dangers. This is particularly crucial when managing projects with several stakeholders since it guarantees that each task owner is aware of their specific accountability for the project’s overall success.
Progress percentage provides details.
Progress percentages in Gantt charts provide project managers with greater insight into the project’s progress and help them to make more informed decisions.
Besides, they also show the timeline of the project, the amount of time it takes to complete certain tasks, and the resources allotted to each task.
Progress percentages in Gantt charts provide project managers with an overview of which tasks are being prioritized, how much time it takes to complete certain tasks, and the status of a project over a period of time, including where any bottlenecks have occurred. Assigning progress percentages to individual tasks helps to quantify the effort expended and make fine tracks to completion percentage. This allows a project manager to easily identify tasks that are on track, off track, or at risk of not meeting deadlines.
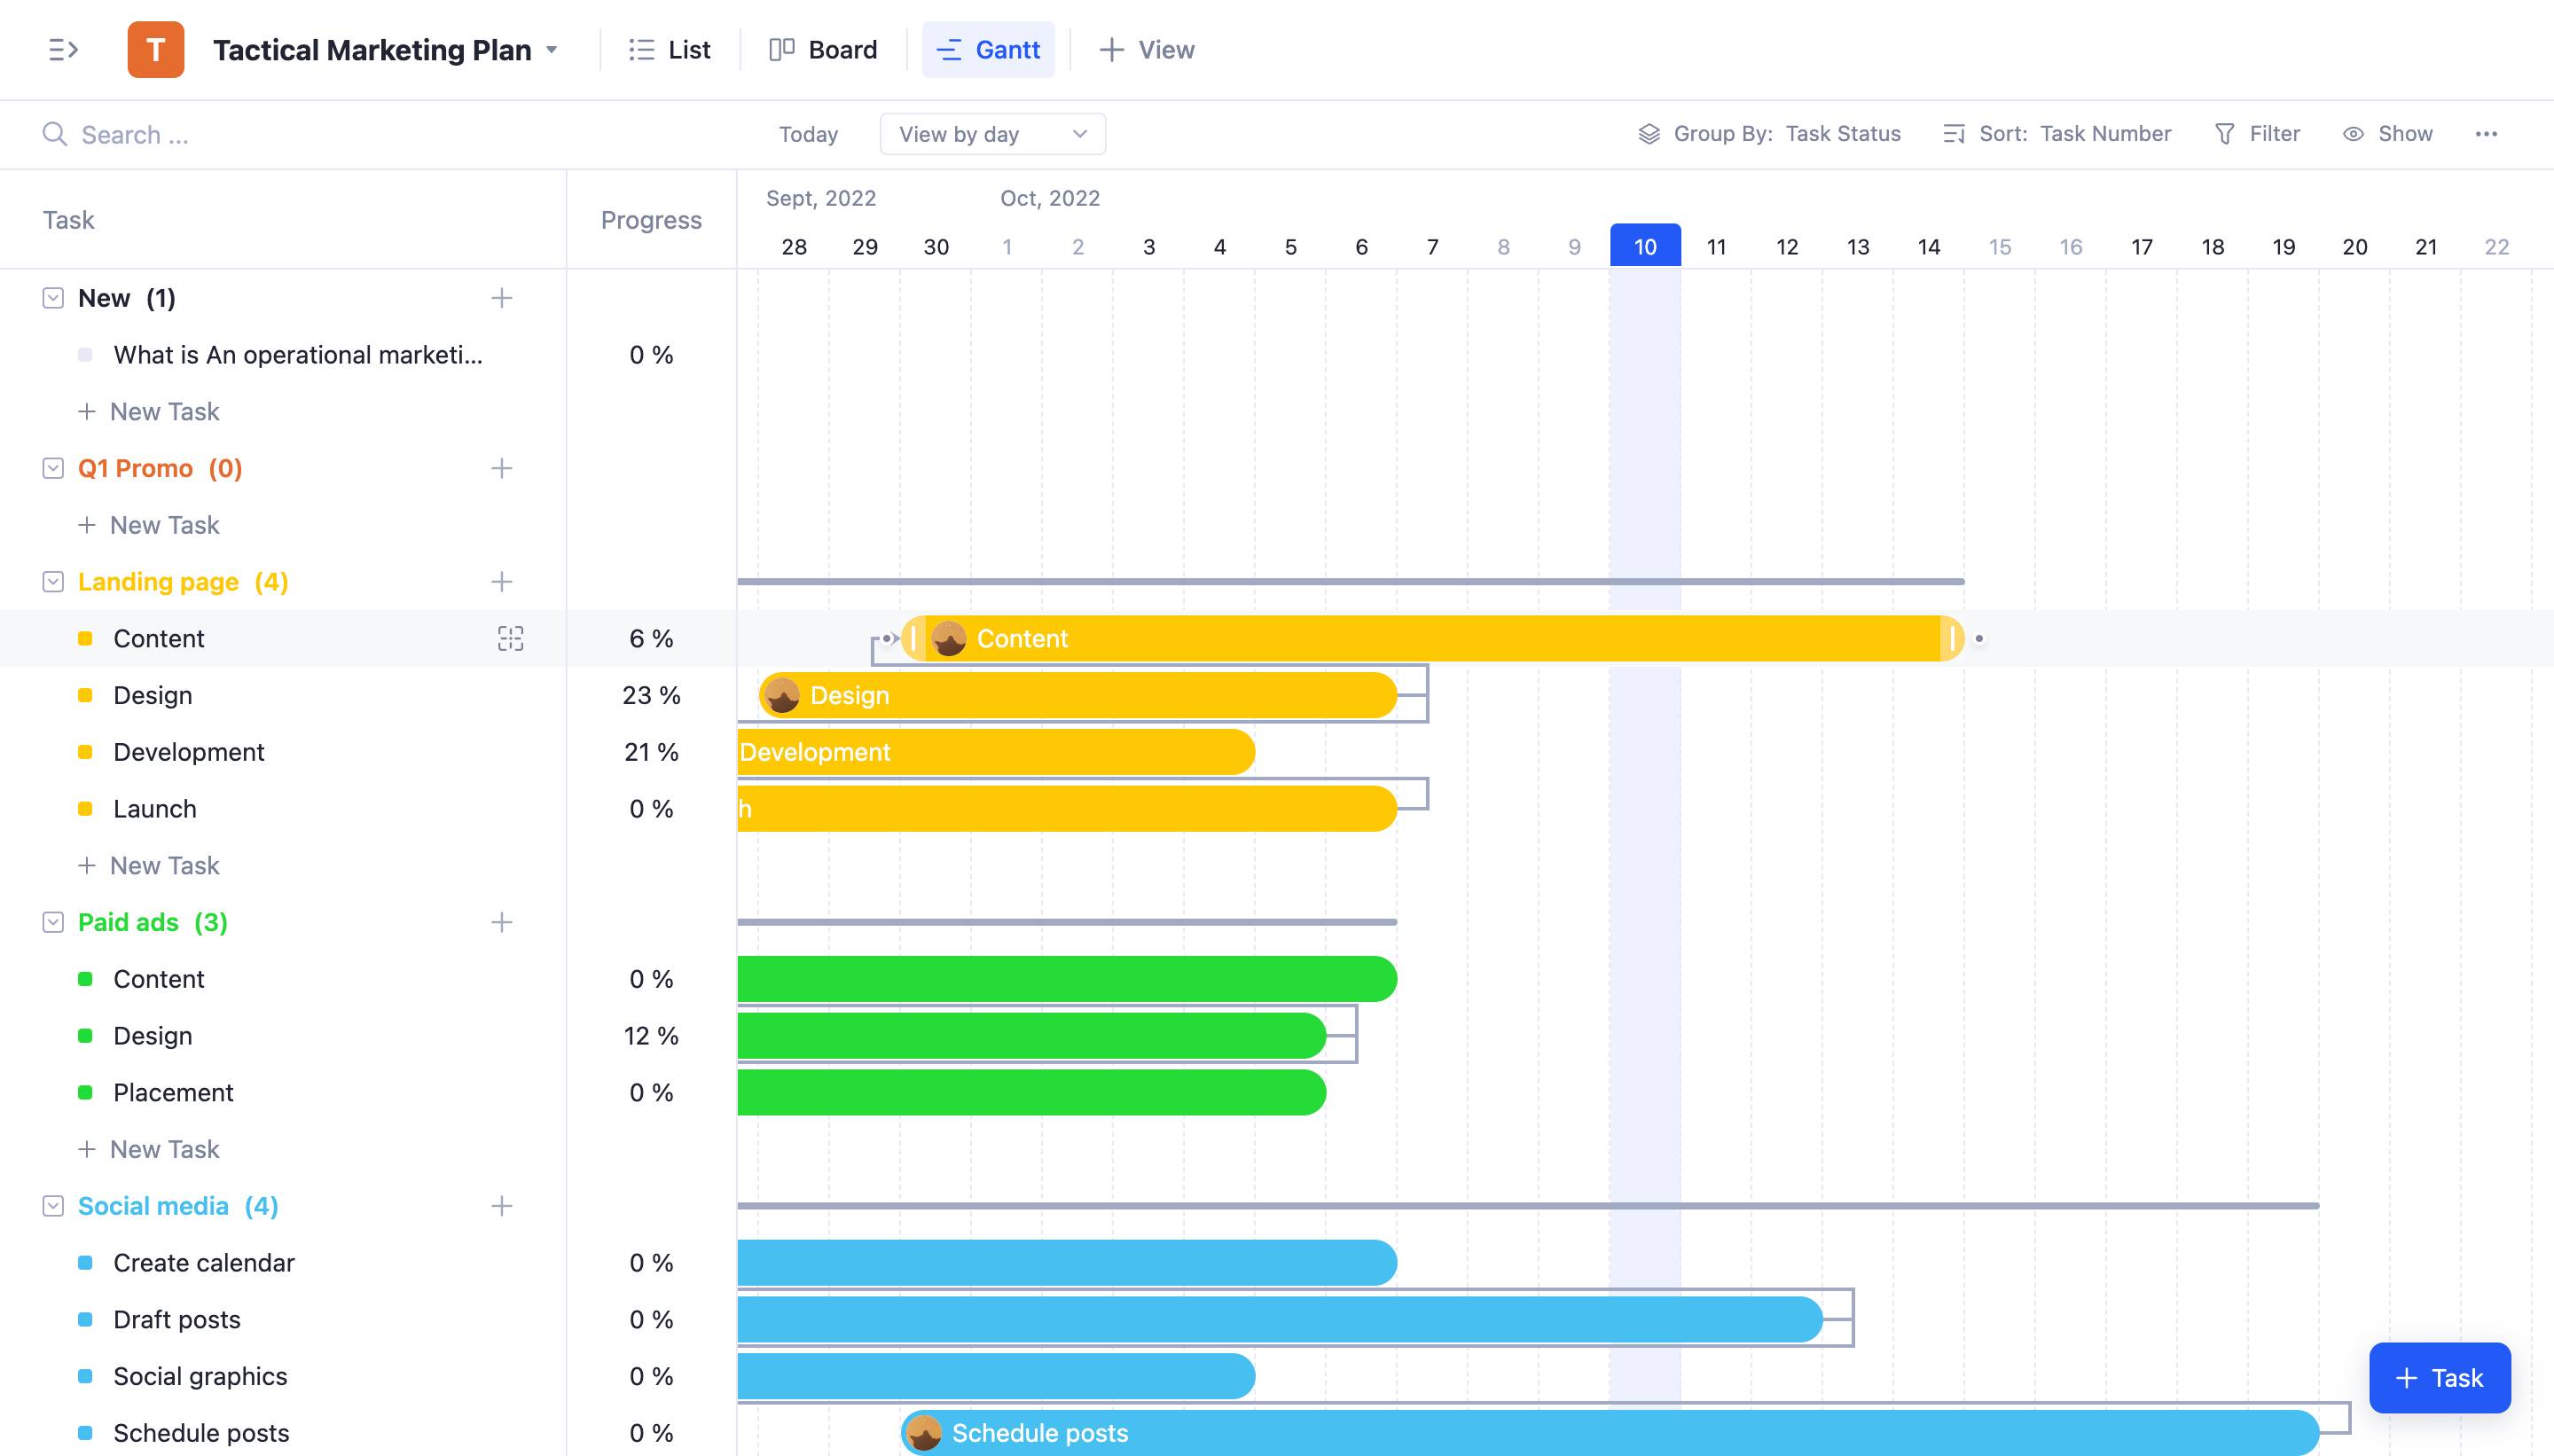
Progress percentages in Gantt charts are an invaluable tool for project managers. They allow them to easily identify those tasks that need more attention and those that are already on the right track. They can also effectively measure the amount of efforts made by the team and the progress achieved by tasks. This encourages team members to stay productive while closely tracking their performance and efficiently utilizing their time.
With Tracup‘s progress percentage feature, users can easily identify which task is in progress or finished. With more and more tasks and members participant, the percentage will also become more and more useful when tracking details.
The End
A Gantt chart has various benefits for teams and project managers. Project managers and teams may easily see which tasks, milestones, and deadlines are still outstanding by using a Gantt chart. This assists in avoiding errors and missing deadlines brought on by poor teamwork or communication. The immediate historical comparison of the project’s progress to the initial plans made possible by Gantt charts also aids project managers and teams in identifying areas for success and development. Finally, Gantt charts may be a helpful tool for planning resources, budgeting, and preventing team communication failures.
You may always send us an email at todd@tracup.com with your suggestions and experiences, which we could include in any of our next pieces. Please forward this content to anybody you think would find it interesting. Discover more at Tracup blog.
Try Tracup Free and Start Your Productivly Development
Using Tracup to Unlock Powerful Agile Workflow WITHOUT ANY Agile Experiences Required